ANALYSING QUANTITATIVE DATA
The first step to quantitative data analysis is to summarise your data using descriptive statistics such as frequencies, percentages, means or medians; which of these you use to summarise your data depends on the type of data you collected. If your data is numerical, summarise them using means or medians. If you data is nominal (i.e., responses fell into categories like male/female) or ordinal (i.e., responses can be logically ranked like agree/neutral/disagree), the appropriate way to summarise your is by using frequencies and percentages.
Means or medians are used for data that is continuous, in other words has an unlimited number of possible values. Examples include age, years of education, number of children. The mean is calculated by adding up the values of each data point and dividing by the number of people providing the data. The median is the number that separates the data sample in half, so it will be the data point in the middle after re-arranging the data points in order if you have an odd number of data points, or the average of the two data points in the middle if you have an even number of data points.
Means or medians are used for data that is continuous, in other words has an unlimited number of possible values. Examples include age, years of education, number of children. The mean is calculated by adding up the values of each data point and dividing by the number of people providing the data. The median is the number that separates the data sample in half, so it will be the data point in the middle after re-arranging the data points in order if you have an odd number of data points, or the average of the two data points in the middle if you have an even number of data points.
Example: You have 5 participants who are aged 65, 68, 67, 71, 68.
To find the mean age, you sum their ages and then divide it by the number of people: (65 + 68 + 67 + 71 + 68)/5 = 339/5 = 67.8.
To find the median age, you arrange the data points in order and find the mid-point: 65, 67, 68, 68, 71, so the median is 68.
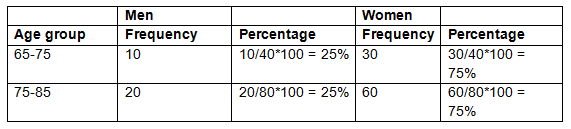
Frequencies and percentages are used for data that is categorical or discrete, in other words numerical values that have been divided into sets of values (e.g., age groups: 65-69, 70-74, 75-79, 80-84, 85+). These five groups could be coded as 1 to 5 during data entry; however, it would not make sense to calculate a mean for these response categories. What does it mean if you found that the average was 2.35? You may also find that it would be inappropriate to report an average if most of your participants mainly came from the youngest and eldest groups, rather than clustering in the middle. Once you know how many people there are in each category, you can express this as a percentage. This standardises the data and makes comparisons easier (see table below).
You should always be aware of any biases there may be in your data as these may affect the conclusions that you can draw from them. There are various reasons that your data may be biased, some common reasons include:
Individual characteristics of the participants, for example, the level of cognitive impairment, personality, psychological distress, carer burden etc., may also affect their responses. It is good practice to note down any information that you think may affect the validity of your data, and take them into consideration when interpreting the data and drawing your conclusions.
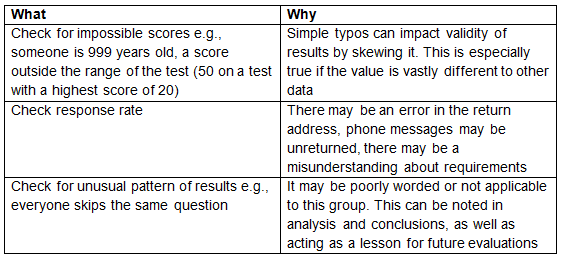
Some simple checks you can routinely do during data collection and data entry:
- The response rate to your survey was low
- Your sampling was not random
- Participants had a tendency to skip certain questions or sections
- Participants selected socially desirable responses with sensitive questions
Individual characteristics of the participants, for example, the level of cognitive impairment, personality, psychological distress, carer burden etc., may also affect their responses. It is good practice to note down any information that you think may affect the validity of your data, and take them into consideration when interpreting the data and drawing your conclusions.
Some simple checks you can routinely do during data collection and data entry:
The methods outlined above can help you describe your data and identify patterns. Depending on the intended purpose and audience of your evaluation, this could be adequate. However, generally if you want to reliably demonstrate an effect you will need to use inferential statistics. Inferential statistics refer to statistics that allow us to test associations between the data. These include t-tests for continuous data and chi-square tests for categorical data. A complete discussion of inferential statistics is beyond the scope of this course. However, you should have a clear understanding of what data you need to achieve your evaluation objectives. This will allow you to identify what statistical advice you require - ideally during the planning phase of the evaluation. Further, good data management practices will mean that should you engage someone else to do the data analysis later, they will be able to understand and work with the data you collected.
